The annual core consumer price inflation (CPI) rate in the United States, which excludes volatile items such as food and energy, fell to 4.1% in September 2023, the lowest in two years. The downward trend of the core CPI has continued for a year almost unanimously and this seems a good response to the policy rate hikes by the FOMC starting from March 2022.
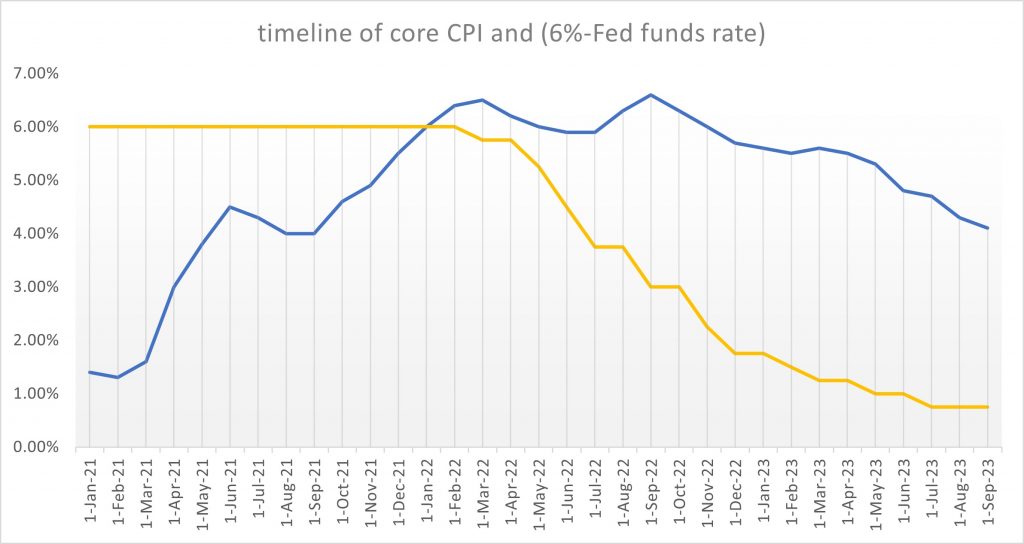
I have shown the CPI data and policy rates versus time in the following graph. Note for a technical purpose, I am using (6% minus fed funds rate) in the graph so that we can conveniently see a similar trend curve to that of the CPI. The two curves would ideally look similar with a shift of a time delay that is needed for the changes of monetary policy to be transmitted to the economy and inflation, without considerations of other factors such as fiscal policies that would affect inflation dynamics.
From the graph, I have the following three findings:
1/ The time of monetary transmission is about 8 – 12 months in nominal.
2/ It is very likely that in the next few months, we will see a large and steep dip of inflation to extend its curve convexly to match the shape of the interest rate curve (yellow line).
3/ We are less than a year away to reach the inflation target of 2%. The FOMC might need to think about cutting policy rates in Q2 next year and actually start to cut in Q3 latest.
I do not have much concern on “tight” labour conditions and wage pressures and their impact on inflation in the next few months to a year. The biggest risk is likely the two on-going wars which could disrupt the oil market.